
PERFORMANCE
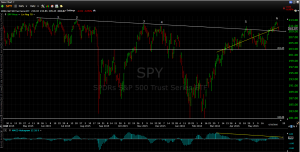
The SPY (SP500 ETF) made a run at its all time high on Wednesday, but fell short. The SPY closed at 212.37, the all-time high was 213.50 set on May 21, 2015. The market sold off after that closing on Friday at 210.07, dropping a little more than 1% from Wednesday. The market has now made six attempts over the last year at cracking the high but has failed. However, it still is holding above the declining trend line dating back from last year.
According to this week’s Barron’s, 23 times since 1929 has it taken 300 days or more to make a new high. But when it has happened, the SP500 has advanced an average of 15.6% during the following year.
Of course, there is also the chance that the failed attempt will lead to a sell off, as did the previous five attempts. There is a negative divergence between the moving average convergence divergence (MACD) histogram on the bottom of the chart and the price action up top (see the yellow lines). The MACD, which measures the relationship between the 26-day and the 12-day moving average, is trending down while the SP500 has been trending up. That is called a negative divergence. Sometimes, certainly not always, such a divergence indicates a weakening of price momentum that will signal a near-term decline in the market.
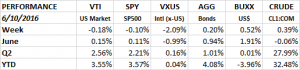
For the week, the SPY was down just barely, -0.10%. International markets took the bigger hit, the VXUS (international x-US ETF) dropped 2.09% on the week. There is new concern that the UK may actually vote to leave the European Union. The markets have been pretty much forecasting a “no” result, but if sentiment begins to trend towards the “yes” camp we could be in for a wild ride in equity markets. Bonds and oil were up on the week, although oil fell 4.2% on Thursday and Friday.
MARKET VALUATION
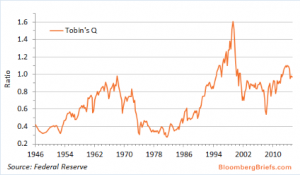
There has been a tug-of-war between those in the overvalued versus the undervalued camp. We have stated before that based on traditional metrics the market is somewhat overvalued (you can argue about the degree), but when taking into account low interest rates, the market might be somewhat undervalued. Here is another notch in the undervalued camp, albeit a very slight undervaluation. Bloomberg Intelligence Economics has recreated Nobel Prize-winning economist James Tobin’s Q ratio. The Q ratio measures corporate net worth and compares the total value of corporate shares against the replacement cost. The ratio is currently 0.97 indicating that the stock market is valued just less than the replacement cost of its assets. An even reading of 1.00 would be fair value.
FED/INTEREST RATES
Janet Yellen gave a speech on Monday and was relatively upbeat. Yellen says positive economic forces still outnumber negative forces. Yellen did not give any guidance on a June or July rate increase.
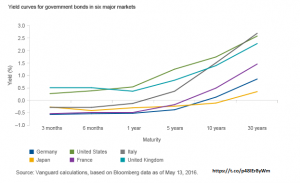
Interest rates fell this week across the curve and got slightly flatter. The 2-year dropped 7 basis points, the 10-year was down 9 basis points and the 30-year was down 11 basis points. There is so much debt at negative yields around the world that investors continue to be drawn to higher yielding US securities. In the chart below, Japan, Germany, France and Italy are all yielding negative rates going out a few years.
JOBS
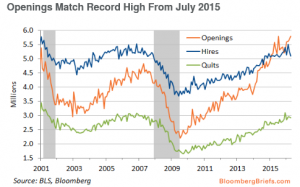
Jobless claims declined to 264k. It was the third drop in four weeks. The Job Openings and Labor Turnover Survey (JOLTS) report for April showed that total job openings are now at their highest level ever. The rate for all separations (people quitting, terminations and retirements) remained roughly flat. Together, these reports are at odds with the negative non-farm payroll hiring report from last week. There might be a mismatch between job openings and the applicants with the proper skills to fill those positions.
ECONOMIC INDICATORS
The OECD U.S. Composite Leading Indicator moved up 0.02 points to 98.9 in April. This was the first increase since July of 2014. Service revenues rose 3.6% year over year during Q1, that was the fastest pace in three quarters. The Freight Transportation Services Index was up 1.3% in April, its first increase in three months.
GDP
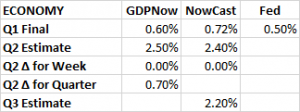
There was no change in the estimates for Q2 growth for either GDPNow or the NowCast. GDPNow is projecting 2.50% and the Nowcast forecasts 2.40% growth for Q2.
SUMMARY
The market came close, but could not break through to a new high. In the 5-previous attempts, the failure led to a sell-off. However, this was the first attempt above the declining trend line.The market is beginning to get nervous about a “yes” vote on the Brexit. Economic data was decent for the week.