The market was up again as all of the equity indexes moved higher. The US total market ETF (VTI) advanced 0.70%, the SP500 ETF (SPY) was up 0.57% and international x-US ETF (VXUS) was up 1.66%. The bonds (AGG) were down 0.39%, the US dollar (BUXX) increased by 0.58%.
At some point there will have to be some kind of pullback in the market. As we have written about for weeks now, the market has not taken the opportunity to head lower on the many instances it had the chance. Thursday looked like one of those days. The market dropped by about 1/2% and closed near its low. On Friday, the market headed lower out of the gate but managed to rally to close at about break even. There was no follow through and that has been the case since February 11.
The volatility index (VIX) is down to levels we haven’t seen since August of 2015. The VIX will usually move opposite the direction of equity markets. So if the stock market is going down, the VIX will be going up. We wrote a few weeks ago that with so many traders betting on spike in volatility, they might end up on the wrong side of the trade, and that is what happened. But as the VIX pushes lower and lower it is indicating that the traders are just too comfortable and they are ignoring short term risk. The equity market will respond and go lower and the VIX will go higher. It does not have to be a dramatic move lower, but some kind of market pullback would make sense. On the other hand, you can make the argument that I am not the only person thinking that so maybe the market will continue to move higher uninterrupted.
Earnings were disappointing for the big tech companies. Weaker than expected earnings from GOOG, MSFT, AAPL, NFLX and INTC pushed those companies lower. Also, high quality, low volatility type companies (like KO, VZ and utilities) under performed.
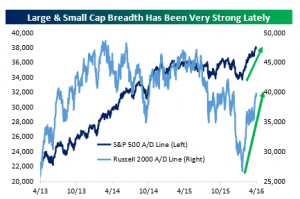
On the plus side, market breadth, which is a measure of advancing and declining stocks, has been moving higher. Often a divergence between market prices and market breadth will foretell a change in market direction, but the fact that they are both moving up together is a positive sign.
Long dated bonds in the US fell and that led to losses for the aggregate bond index. As interest rates go up, bond prices go down. The move higher in rates might be a result of investors anticipating higher growth and/or inflation.
MARKET REVIEW/OUTLOOK
We did our quarterly Market Review/Outlook for BlueKey last week. It is about a 30-minute presentation. Please check it out and contact us with any questions.
ECONOMY
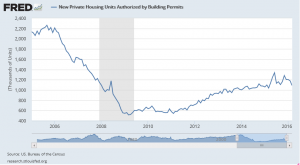
Housing reports were weak. Housing starts declined by 8.8% and building permits were down 7.7% compared to the previous month. The building permit number is now less than the previous low set in September. Part of the problem is that builders are focused only on high end homes whereas the demand appears to be at the lower price points.
The Conference Board’s Leading Economic Index increased by 0.2%. This was the first increase in four months. Year over year it was up 2.2%, suggesting slow but steady growth.
The Philly Fed General Business Activity Index fell 14 points to -1.6. This reversed the gain from last month and put the index back in contraction territory.
It was another banner week for initial jobless claims. The number fell to 247k. This is the lowest level since November of 1973. The job market continues to be strong and is near full employment levels.
OIL
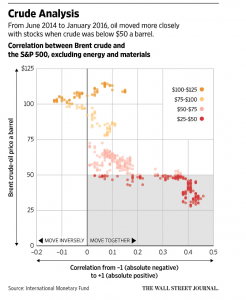
When the price of oil has been less than $50 per barrel, there has been a high correlation between its price and the stock market. This becomes even stronger between $25 and $40. When oil started to fall south of $50 it really began to threaten debt markets, led to big pullbacks in capital spending and job cuts, which led to the equity markets falling with the price of oil. The markets worried about spillover effects. As the price approaches $50 the correlation should begin to go back to normal.
EARNINGS
Earnings have not been that bad. To date, 26% of SP500 companies have reported. 76% have beaten earnings estimates and 55% have beaten sales estimates.
SUMMARY
Short-term momentum continues to be a powerful force moving the market higher. Interest rates turned higher and that will have to be watched. Economic statistics continue to be mixed, but that has been the case for a long time now, we are in a flat to very slow growth economy, but the job market is strong.


