No commentary this week due to the holiday. Below is our weekly scoreboard:

No commentary this week due to the holiday. Below is our weekly scoreboard:
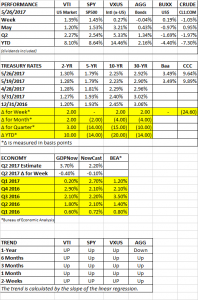
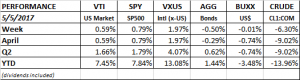
PERFORMANCE
The firing of FBI Director Comey remained in the news this past week. Markets headed south on Wednesday, dropping 1.8%, on news that Trump had asked Comey to “let it go” in regard to the FBI investigation of former adviser Michael Flynn’s ties Russia. That started talk of impeachment and the prospect of President Pence. Later in the week former FBI Director Robert Mueller was named as special counsel in relation to the Russia investigation. It is way too early to give a serious nod to the possibility of impeachment, but all of this political upheaval does reduce the chance of any of Trump’s initiatives getting passed.
As it was, the market recovered towards the end of the week and US equities were only down by 0.3%. International stocks were up 0.9%. Crude advanced by over 5%.
Bonds rallied as interest rates fell.

The spread between the 10 and 2-year treasury note fell to below 1% for the first time since October.

ECONOMY
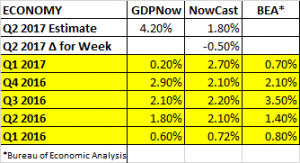
The GDPNow forecast for Q2 growth increased by 1/2% to 4.1% and the Nowcast increased their growth estimate to 2.3% from 1.9%.
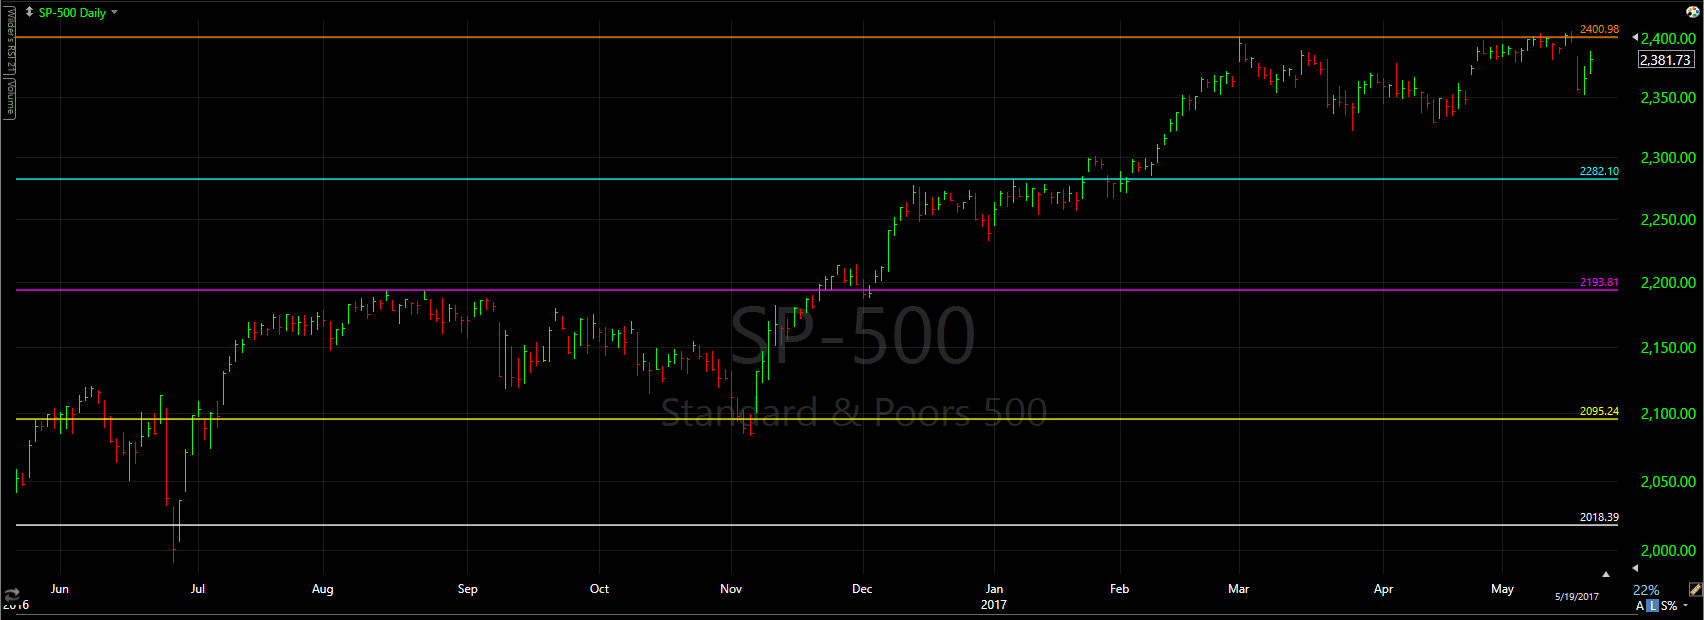
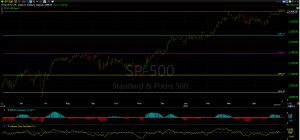
TECHNICAL CHART
The market still remains below the 2401 line we have been watching. It did go through it on Monday and Tuesday, but could not hold the gains.
In this article, written by the legendary Ben Graham in the spring of 1960, Graham warns of the unusually high valuation metrics in the early months of 1960. The article is based on a talk he gave on December 17, 1959. Graham writes about the high multiples like p/e, and the article is somewhat similar to the valuation arguments you hear today. Graham warns that there might be danger ahead.
In the first nine months of 1960, the market declined by about 15%. But after that it rallied by 26% through the end of 1961. From there, equities entered a bear market through the end of June of 1962 falling 23% and down 17% from their high at the end of 1959. After that, the market would rally through 1965.
Before the bear market began, some stocks like Texas Instruments and Polaroid were trading at p/e ratios of 115 times. The bear market even included a “flash” crash on May 28, 1962 where many stocks dropped 5 to 10% within minutes. The Dow fell 5.7% on that day.
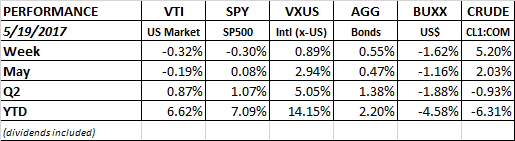
PERFORMANCE
The SP500 cracked through its all time high on Monday and Tuesday, but could not hold the gain and fell slightly through the end of the week. The index was down 0.3% while the NASDAQ managed a 0.1% gain.
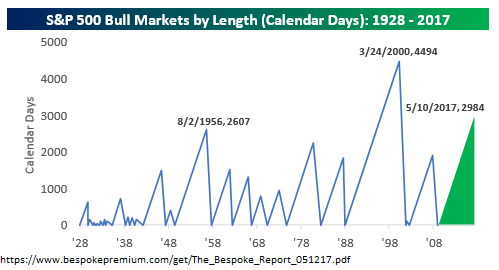
The US bull market is now 2,984 days old. That is the second longest bull run since 1928.
Treasury yields generally fell by a few basis points out to ten years on the treasury yield curve, helping move the bond index higher by 0.20%. The dollar and crude were also up.
Retailers fell hard. Macy’s dropped by 17% on Thursday and Nordstrom was 11% lower on Friday. On-line commerce continues to hammer away at the brick and mortar retailers. Retail overall has been ok. Sales were up 0.4% in April and on-line retail was up 1.4%. Year over year, retail sales were up 4.7%.
The earnings story for the S&P 500 is positive. Q1 earnings might rise 14% year over year.
International equities were just above break even for the week.
TRUMP FIRES COMEY
Trump fired FBI chief James Comey which brought back memories of Nixon’s dismissal of Watergate special prosecutor Archibald Cox in 1973, in an event that became known as the “Saturday Night Massacre.” That, along with some really bad economic policies such as price controls, set off several years of economic hardship that included 9% unemployment, 12% inflation, a 13% fed funds rate and a GDP measure that sank by 3.2%. The economy is much different now and appears in better shape, but the memories are somewhat eerie.
One thing that might not be so different is that the stocks driving much of the market advance were part of a select group. Then, it was the “Nifty 50”, considered stocks that you could buy and hold forever. Today, we have the FANG, and even more exclusive set.
OIL
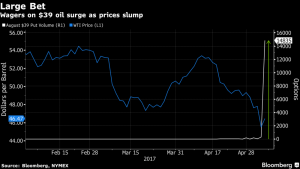
Oil has fallen 15% this year but rallied 5% in the last six days. Inventory fell more than expected. The international energy agency said that supply and demand are beginning to come into balance, and that inventories might begin to decline if OPEC extends production cuts beyond May. The recent drop in crude might have flushed out the remaining oil bulls. This might be laying the ground work for an advance in oil prices.
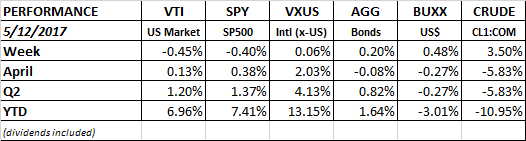
PERFORMANCE
The SP500 hit an all-time closing high on Friday, finishing at 2399.29. The index is now pushing up against its all-time intra-day high of 2400.98.
Overall US equities were up by about 0.60%. International equities continued to outpace US equities, +1.97%. Bonds fell as interest rates increased, the dollar was flat, and oil tumbled by over 6%. Volatility is ridiculously low, the VIX is at 10.97, close to a 10-year low. But investors are not overly optimistic. The AAII bullish sentiment is at 38.1%, less than the historical average of 38.5%. On the other hand, investors are also not pessimistic, the survey shows that bearish sentiment, expectations that prices will fall over the next six months, fell to 29.9%. The lowest reading since February 8.
GDP
The Atlanta Fed’s GDP model came out with their first estimate for Q2 growth on May 1 with a sizable increase over a weak Q1, projecting growth at 4.3%. That was revised down to 4.2% later in the week on light vehicle sales. The NY Fed’s Nowcast projects Q2 growth at 1.8%, down from 0.50% from last week on a weak ISM manufacturing report.
JOBS
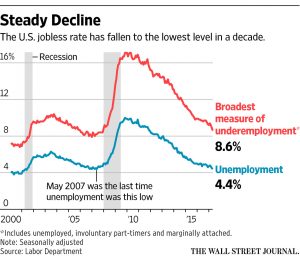
The unemployment rate fell to 4.4%, its lowest level since May of 2007. Non-farm payrolls increased by 211,000, a big improvement over the 79,000 increase in March. The hiring increase was broad-based but hospitality led the way adding 55,000 new jobs, 37,000 jobs were added in healthcare. Even retail managed to hire 6,000 new employees. The labor force participation rate remained low, at 62.9%, consistent with the past few years and just above a four-decade low. Average hourly earnings increased by 2.5% year over year, narrowly outpacing the 2.4% increase in the consumer price index.
FED
The Fed kept interest rates steady at their meeting this week. The Committee said that the slowdown in growth in Q1 “as likely transitory.” That means, at least for now, the Fed still considers itself on track for two more rate increase this year. There is a good possibility the Fed will raise rates in June.
OIL
We said at our quarterly webinar that one risk to the market would be a collapse in oil prices. That was a contributing factor that led to the big market selloff at the beginning of 2016. Oil is down to about $46 per barrel from just north of $50 only a few weeks ago. Worries about weakening Chinese demand has hurt the pricing on all commodities. Options traders are starting to bet on fall below $40. The big spike in trades could be a sign of a peak in fear, and a contrarian would say this would be the time to get long for a recovery. But if oil continues to fall, especially if is breaks $40 to the downside, it might drag the market with it.
MANUFACTURING
In the US, the ISM Manufacturing Index fell by 2.4 points to 54.8, the biggest drop since August. The decline indicates a small slow-down in manufacturing activity, but still up from last year.
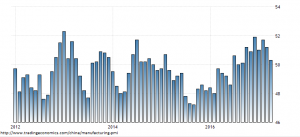
The Chinese Caixin Manufacturing PMI fell to 50.3 from 51.2. The reading was the weakest since September of 2016, although a reading above 50 still indicates expansion, although very slight. New export orders fell, there was weakening business confidence and employment fell the most since January.
PMI readings were much more positive in Europe.
Sweden 62.5
Spain 54.5
Switzerland 57.4
Italy 56.2
France 55.1
Germany 58.2
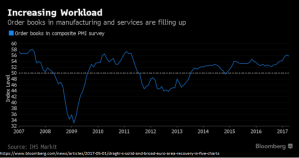
Overall, 87% of countries reported growth.