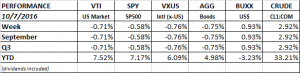
Week Ending 10/28/2016

PERFORMANCE

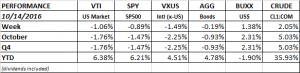
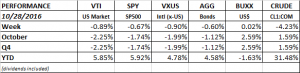
US equity markets fell in the US and around the world fell about 0.9%. Bond markets also fell about 0.6%. Interest rates have been rising and that has pushed bonds down and has been a drag on equities. Interest rate sensitive stocks like REITs fell. The Vanguard REIT ETF (VNQ) fell 3.6%. Regional banks rallied by 2.6% (KRE). Banks are likely to be helped by higher interest rates.

performance-10-28-2016

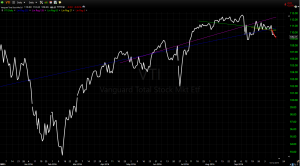
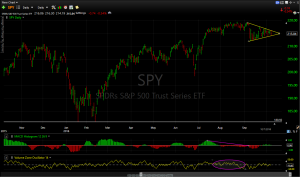
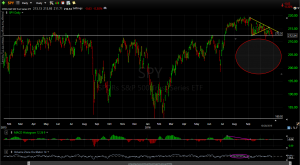
The stock chart of the SPY (SP500 ETF) is showing a descending triangle. Some technical analysts consider that a bearish pattern that shows distribution of stocks. We are slightly overdue for a pullback at this point (see our Webinar from last week, link below), and given all the political uncertainty, there is a reasonable (not definite) chance for a selloff. You can also make the opposite case that if the market can hold support in the 212 area it can break out of the triangle to the upside.
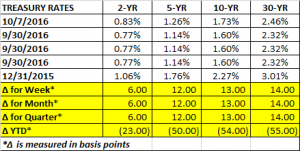
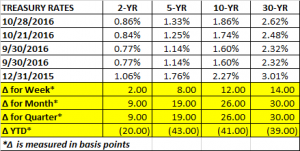
spy-10-31-2016

TREASURY RATES

The treasury curve continues to get steeper. The 10 and 30-year were up by 12 and 14 basis points for the week, while the 2-year increased by only 2 basis points. For the entire month, the 2-year increased by 9 basis points and the 10-year by 26 basis points.

treasury-rates-10-28-2016

EARNINGS

According to Factset, 58% of SP500 companies have now reported earnings. 74% have beaten the mean estimate and 58% have beaten the mean sales estimate. So far, the blended earnings growth rate is 1.6%, it that trend continues, the 5-quarter losing streak for earnings (consecutive quarters of declining year over year earnings) will end.

GDP

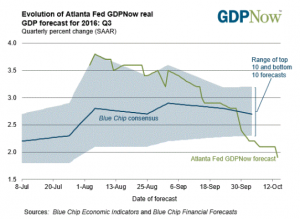
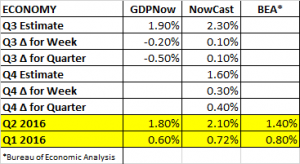
The initial estimate for Q3 GDP by the Bureau of Economic Statistics came in at a surprisingly strong 2.90%. That beat the Q2 number (1.4%) by more than double. Meanwhile, GDPNow is estimating Q3 growth at 2.1%. The Nowcast remained unchanged at 2.2% for Q3 and 1.4% for Q4. The economy continues in slow growth mode.

LINK TO OUR QUARTERLY WEBINAR:


Week Ending 10/14/16

PERFORMANCE

Equity and fixed income markets were down on the week. US markets fell by about 1% and international markets by about 1.50%. Bonds declined by 0.19%, as the longer end of the curve got steeper.

performance-10-14-2016

Earnings season got off to a poor start on disappointing earnings by Alcoa. SP500 earnings have declined for five quarters in a row, and the expectation is for a small decline for Q3. However, normally earnings come in a little bit above expectations, so there is hope that the earnings slide might end.

A rising dollar (+1.38% for the week) also has not helped. That would cut into US exports and lower earnings from overseas, impacting US large-caps. The British pound fell by 2.17% as Brexit becomes closer to reality. A lot of the increase in the dollar was due to the fall of the Pound.

The political environment certainly has not done anything to help improve long term confidence in the US economy, unless one considers that Trump’s chances to win seem to have fallen. Not that the alternative is much better.

Technically, the market is starting to roll over from positive to negative. The chart below shows the price action of the US total stock market as measured by the VTI ETF. Prices are shown in white. The colored lines measure a linear regression for different lengths of time. When the regression line is moving higher, the trend is up for the given period. Likewise, when the regression line is moving down, so is the trend. For periods of 5-days (red), 21-days (yellow) and 63-days (green) the trend is down. For the two longer periods, 126-days (purple) and 252-days (blue), the trend is still up. This does not necessarily mean that the prices will continue down, but it is a different way to see that the market has lost its short-term positive momentum.

linear-regression-chart-10-14-2016

ECONOMY/GDP

The Atlanta Fed’s GDP forecast for Q3 growth continued to fall. It has pretty much been one-way down since the original forecast in late July (see below). The estimate is now at 1.90%, which is down from 2.10% last week. The decline was impacted by a lower estimate of personal consumption expenditures.

gdpnow-chart-10-14-2016

The NY Fed’s Nowcast estimate for Q3 increased to 2.3% from 2.2% last week. The Q4 estimate increased to 1.6% from 1.3%. Higher than expected retail sales helped push the estimates higher.

gdp-estimates-10-14-2016

Week Ending 10/7/2016

PERFORMANCE

Both US and international equity markets were down about 0.70% for the week. The market is starting to think about a possible December rate increase. The yields on the 5 and 10-year note shot higher by 12 and 13 basis points. That caused interest rate sensitive assets like REITs and utilities to sell off. REITs were down about 5.3% and utilities dropped 3.8%. On the flip side, banks, which would benefit from higher rates, increased by about 2.5%.

performance-10-7-2016

treasury-rates-10-7-2016

The SPY (SP500 ETF) has now been trading in a tight range between 212 and 219.5 since July 7. The range has gotten even tighter over the last few weeks and could break out one way or the other any day now.

spy-10-7-2016

ECONOMY

The Atlanta Fed’s GDPNow forecast for Q3 growth fell to 2.1%, down from 2.4% last week. The fall was due to lower inventory investment and slower government spending growth. The NY Fed’s NowCast for Q3 remain unchanged at 2.2%. The Q4 estimate increased by 0.1% to 1.3% due to strong ISM reports and international trade data.

The Institute for Supply Management’s (ISM) Non-Manufacturing report for September was extremely strong. The reading came in at 57.1 versus 51.4 for August. Above 50 is considered expansionary. It was the largest one month increase in the history of the survey. Combined with the manufacturing survey, and adjusting for the respective weights in the economy, the ISM increased to 56.5 compared to 51.2, also the largest increase on record.

Employers added 156k job in September. The number of jobs added was slightly below the consensus, but it is still a solid number. Until the economy picks up steam and corporate earnings begin to rebound, private sector job growth is likely to remain more subdued than it has been over the last couple of years. The unemployment rate ticked up by 0.1% to 5.0% but that was due to an increase in the number of people now looking for work.

payroll-data-oct-8-2016

Measures of weekly earnings and hourly earnings both improved year over year.wage-growth

Week Ending 9/30/2016

PERFORMANCE

Markets were mostly flat. US equity markets were up about 0.15% for the week. International markets were down very slightly (-0.06%), bonds up 0.17% and the US dollar was down 0.05%. Crude was the big winner, +6.84%, on news that OPEC and reached an agreement to limit production.

performance-9-30-2016

Deutsche Bank frightened the market for most of the week. The US Justice Department made it known in mid-September that it would seek a $14b penalty for mortgage problems prior to the great recession. That number was big enough to get investors thinking about the survival chances for Deutsche. Inevitably, that led to the beginnings of a run on the bank, as some hedge funds pulled money from the bank (its also possible some of these funds were short the stock at the same time). The shares tumbled and brought the market down with it. But on Friday, news was out that the penalty number would be much lower. Shares rallied 14% on the day, and led the market higher.

GDP

The Atlanta Fed’s GDPNow model took another big hit on their forecast for Q3 growth. The estimate fell by 0.4% to 2.4%. The model had fallen by 1/2% the week prior. The decline was caused by a lower estimate for consumer spending growth and by a lower contribution from inventory investment. The NY Fed’s Nowcast fell by 0.1% to 2.2% for Q3. Q4 remained steady at 1.2%. The Nowcast was negatively impacted by personal consumption expenditures and sales of single family homes, but was helped by durable goods orders and wholesale inventory data.