January Recap

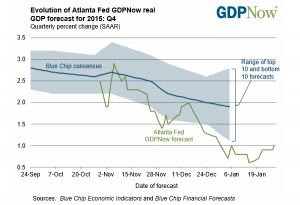
It was the worst start to a year ever, but a small rally towards the end of the month made January the seventh worst opening month start for the US equity markets. According to the Stock Trader’s Almanac, for five of the six other January’s that managed a worse return, gains were positive for the remainder of the year. Fear of spillover effects from China and the price of oil are leading to concern of a recession somewhere down the line. As of now, most economists do not see that happening and are looking to a period of more slow growth ahead. The latest numbers from the Atlanta Fed GDPNow forecast, a week by week estimate of GDP, released on Thursday, show Q4 closing out with a 1% gain. The US Bureau of Economic Analysis released its advanced estimate of Q4 GDP growth on Friday at +0.70%.

GDPNow 1 28 2016

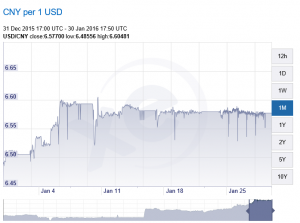
The market got off to a bad start during the first few days of January. There was a trifecta of negative Chinese data that clobbered the market and raised fears of China bringing down the rest of the world economy. The PMI reading out of China was less than 50. The Caixin Manufacturing PMI came in at 48.2, down from 48.6 the prior month but up from 47.2 in September. The currency, the Yuan, also depreciated by about 1.5% during the first week of January (see chart below). Volatilty spiked in the Chinese financial markets as equity price plunged, resulting in the use of newly installed “circuit breakers” that closed the exchanges. This led to even more selling. This combination was lethal and sent equities around the world plunging, the SPY dropped 5.84% by Friday, January 8.

cny chart

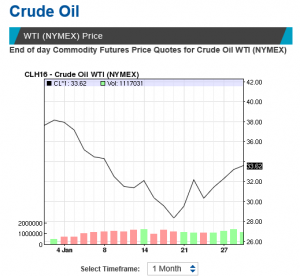
But the damage was not done. The other problem was the falling price of crude oil. Crude oil (West Texas Intermediate) dropped from about $38 per barrel to almost $28 (see chart below) on January 20. Current market prices are well below the marginal cost of production, and if prices don’t rebound there will likely be a wave of defaults in the high-yield fixed income sector. That could lead to negative consequences for the rest of the US economy. Crude began to rebound in the final 10 days of the month, closing January at $33.62.  The SPY dropped to a closing low on January 20 of $185.65. That coincided with the low price in oil for the month and put the SPY at 8.94% off of the 2015 closing price at year-end and 12% off the recent high of November 3. On an intra-day basis, the SPY was off 14.21% on January 20th.

crude oil chart

As crude oil began to rebound, the market slowly advanced. The market received some surprise news on the last trading of the month when Japan went to negative interest rates on excess reserves. The SPY advanced 2.44% on that. In total, since the January 20th close, the SPY has rallied 4.35%.

Fears that the Fed may move too aggressively and continue on their course of multiple rate increases were somewhat alleviated with their comments of January 27, we are “closely monitoring global economic and financial developments.”

For the entire month, the SPY declined by 4.98%, the overall US stock market as measured by the VTI dropped 5.72%, and international markets (x-US) fell 5.45% (VXUS). In a rush to safety, the aggregate bond index (AGG) moved up 1.24%.

Treasury rates fell. The 2-year dropped to 0.76% from 1.06%, the 5-year to 1.33% from 1.76%, the 10-year to 1.94% from 2.27% and the 30 year to 2.75% from 3.01%. High-yield increased, the Merrill Lynch US High Yield Option Adjusted Spread moved up to 7.75% from 6.95%.The High Yield Corporate Bond ETF (HYG) declined by 1.60%.

Materials (XLB) and financials (XLF) fell 10.71% and 8.85% respectively, while utilities (XLU) led the way with a 4.94% gain. The only other positive sector was consumer staples (XLK) which managed a gain of 0.67%.

The weight of the evidence seems to indicate that the US will avoid a recession, but further downside surprises from China or the price of oil could tip the scales.


A Look Back at Corrections/Pullbacks

The market is down about 9% from its recent high on 11/3/2015. So we are bordering on a correction, normally defined as a drop of 10% or more. This is not the first correction and it won’t be the last. Here is a look back at pullbacks and corrections since the summer of 2005.


DATE OF  DATE OF DAYS  CLOSE ON   CLOSE ON   PRICE VIX VIX VIX
HIGH LOW    HIGH DATE   LOW DATE  CHANGE LOW HIGH CHANGE
9/9/2005 10/13/2005        34.00            124.60          117.43 -5.75% 13.5 16.47 22.00%
5/5/2006 6/13/2006        39.00            132.52          122.55 -7.52% 11.62 23.81 104.91%
2/20/2007 3/5/2007        13.00            146.04          137.35 -5.95% 10.24 19.63 91.70%
7/19/2007 8/15/2007        27.00            155.07          141.04 -9.05% 15.16 30.67 102.31%
10/9/2007 11/26/2007        48.00            156.48          140.95 -9.92% 18.88 28.91 53.13%
12/10/2007 1/22/2008        43.00            152.08          131.54 -13.51% 20.74 31.01 49.52%
5/19/2008 7/15/2008        57.00            143.05          120.99 -15.42% 17.01 28.54 67.78%
8/11/2008 11/20/2008     101.00            130.71             75.45 -42.28% 20.12 80.86 301.89%
1/6/2009 3/9/2009        62.00               93.47             68.11 -27.13% 38.56 49.68 28.84%
6/2/2009 7/8/2009        36.00               94.85             88.00 -7.22% 29.63 31.3 5.64%
10/19/2009 10/30/2009        11.00            109.79          103.56 -5.67% 21.49 30.69 42.81%
1/19/2010 2/8/2010        20.00            115.06          105.89 -7.97% 17.58 26.51 50.80%
4/23/2010 7/2/2010        70.00            121.81          102.20 -16.10% 16.62 30.12 81.23%
8/9/2010 8/26/2010        17.00            112.99          105.23 -6.87% 22.14 27.37 23.62%
2/18/2011 3/16/2011        26.00            134.53          126.18 -6.21% 16.43 29.4 78.94%
4/29/2011 6/24/2011        56.00            136.43          126.81 -7.05% 14.75 21.1 43.05%
7/7/2011 10/3/2011        88.00            135.36          109.93 -18.79% 15.95 45.45 184.95%
10/27/2011 11/25/2011        29.00            128.53          116.31 -9.51% 25.46 34.47 35.39%
12/7/2011 12/19/2011        12.00            126.73          120.29 -5.08% 28.67 24.92 -13.08%
4/2/2012 6/4/2012        63.00            141.84          128.10 -9.69% 15.64 26.66 70.46%
9/14/2012 11/15/2012        62.00            147.24          135.70 -7.84% 14.51 17.99 23.98%
5/21/2013 6/24/2013        34.00            167.17          155.73 -6.84% 13.37 20.11 50.41%
1/15/2014 2/3/2014        19.00            184.66          174.17 -5.68% 12.28 21.44 74.59%
9/18/2014 10/16/2014        28.00            201.82          186.27 -7.70% 12.03 25.27 110.06%
5/21/2015 8/25/2015        96.00            213.50          187.27 -12.29% 12.11 36.02 197.44%
11/3/2015* 1/8/2016        66.00            211.00          191.92 -9.04% 14.54 26.39 81.50%

*The correction that started on 11/3/2015 is still in progress.

SEC adopts new Crowdfunding regulations

On October 30, 2015, after three and a half years of proposals, comments, and discussion, the Securities and Exchange Commission (SEC) announced its final rules on equity crowdfunding for small businesses. The forms that funding portals use to register with the SEC become effective on January 29, 2016, while the final regulations take effect on May 16, 2016.

Small businesses considering this new financing alternative will want to review the new regulations carefully.

Click for more info.


Recap for December/Q4/2015

Major market indexes finished just about flat in 2015, but that disguised some pain as many stocks and sub-indexes were in the red for the year. The SPY was the star performer, up 1.27% for the year (including dividends), the overall US market (VTI) gained 0.36%, and international markets (x-US) lost 4.20%. The aggregate bond index (AGG) managed a gain of 0.48%.

For Q4, the SPY advanced 7.02%, VTI 6.24%, VXUS 2.57%. The bond index (AGG) fell 0.51% as the Fed raised interest rates in December. However, the year did not end on a good note despite the positive Q4 returns for equities. For December, the SPY dropped 1.73%, VTI -2.13%, VXUS -2.18% and the AGG -0.19%.

The market topped out on May 21, and then suffered a 12.29% correction that ended on August 25.  The market rallied from there but did fall 5.2% between November 13 and December 20th

Underneath the positive SPY and VTI numbers, most equities were down. Take out eight large-cap out performers like MSFT, AMZN, FB and GOOGL/GOOG, and the SP500 would have down by 4% according to Jessica Binder Graham of Goldman Sachs.

For the year, the midcaps (VO) fell 1.35%. Small-caps as measured by the IWM fell 4.46%. Dividend growers fell (VIG) 1.92%.  Emerging markets (VWO) were down 15.82%. The big winner was large cap growth as measured by the QQQ, up 9.43%. Materials (XLB) were down 8.65% and energy (XLE) was down 21.47%. Consumer discretionary (XLY) was up 9.93%.