Week Ending 5/20/2016

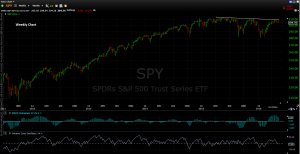
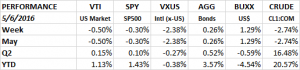
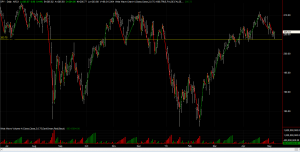
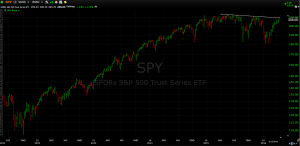
Happy, or maybe, not so happy, anniversary. It was one year ago on May 21 that the SPY (ETF for the SP500) hit it’s high of $213.50. On Friday it closed at $205.49. That is a drop of 3.8%. Although adjusted for dividends, the drop is only 1.7%. So basically the market is in about in the same position as last year, with some pretty good volatility along the way to the down side.

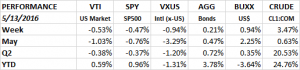
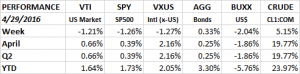
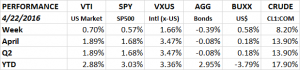
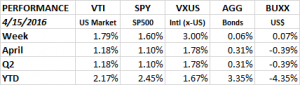
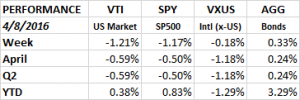
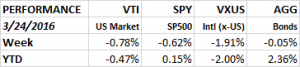
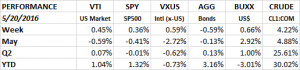
The markets had lots of ups and downs this week but when it was all over equities did manage a gain of 0.45% on the VTI (overall US stock market) and 0.36% on the SPY.  International stocks (VXUS) were up 0.59%.

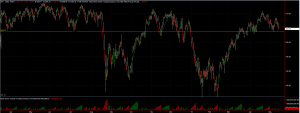
On Monday the market shot higher by almost 1% on news of Warren Buffet’s Berkshire Hathaway’s $1b investment in Apple. But that gain didn’t hold as the market reversed direction and fell 0.9% on Tuesday on fears that interest rates will rise faster than expected this year. Wednesday was an up and down day and the market finished at its midpoint, roughly in line with the previous day. Thursday the market dropped below the support line of $203.90 but managed to rally and closed above that number. And on Friday the market advanced to finish with a modest gain for the week.

SPY 5 20 2016

The US dollar also increased, up by 0.66%. The USD is now up 2.92% for the month

Performance 5 20 2016

FED / INTEREST RATES

Higher CPI numbers (see below) as well as upbeat housing and industrial production reports got the market anticipating that an interest rate rise might happen sooner (June or July) rather than later. That was confirmed on Wednesday when the Fed released their minutes from the April meeting. Inside the minutes was this quote, “Most participants judged that if incoming data were consistent with economic growth picking up in the second quarter, labor market conditions continuing to strengthen, and inflation making progress toward the Committee’s 2 percent objective, then it likely would be appropriate for the Committee to increase the target range for the federal funds rate in June.”

We think that the key words in this quote are that “[if] labor market conditions continue to strengthen,” that is something that has not happened since the April meeting. Labor markets have been flat at best.

Despite that, recent comments by other Fed officials have emphasized that the market was out of line with the Fed’s desire to increase rates two times this year. Markets were anticipating maybe one cut late in the year. But now the markets are finally getting the message. In the last week, the chance of a June rate hike has increased from less than 10% to over 30% now.

YIELD CURVE FLATTENING

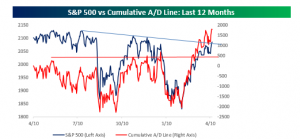
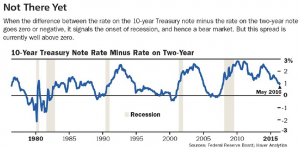
There has been a lot of talk about the flattening of the yield curve and if that is telling us something about a possible recession down the road. The 2-year note has increased this month by 12 basis points while the 10-year is up by only 2 basis points, meaning the spread has fallen by 10 basis points to .96 as of Friday, down from 1.21 at the end of last year. The spread is now at its narrowest point since December of 2007. The 2-year has been rising due to the possible Fed increase and the higher CPI numbers (see below), while the 10-year is being held down by negative rates overseas.

As written about in this week’s Barron’s, the spread normally has to hit zero to indicate the onset of a recession.

10 yr rate less 2 yr rate Barrons May 23 2016

APPLE

Warren Buffet’s Berkshire Hathaway announced on Monday that they had taken a $1b in stake in Apple. We wrote on April 29th that Apple shares looked cheap and it looks like at least one other person noticed! The shares jumped 3.7% on the news, or $18.4b in terms of market capitalization.

YUAN

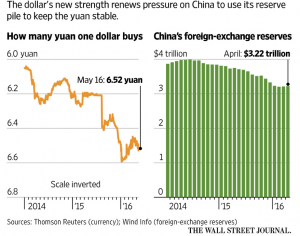
After a frightening start to the year, the Chinese yuan picked up steam and rallied into late April. But since then, the yuan has been falling against the dollar to the tune of 0.6%. The People’s Bank of China’s (PBOC) mandate is to promote growth, often by pumping currency into the economy. That weakens the yuan. But if the currency weakens too much, Chinese business and citizens will look to get money out of the country and into safe-havens like the United States. That has been happening for a while now, but the recent yuan rally brought some relief. If the currency continues to fall that will accelerate the process. The PBOC might be forced to step into their falling reserves to defend the currency.

But there are other consequences to a lower yuan. The big market selloff at the beginning of the year was due in large part to slowing economic growth in China coupled with the weakening yuan. The selloff was a worldwide phenomenon. As the currency falls, Chinese exports should increase and imports decrease. That means lower growth across the globe. The fear of a domino effect that impacts economies worldwide might lead to another market sell off.

The number one goal of the Chinese government is social stability and that means a steady currency. We expected a gradual decline in the value on the yuan and we will have to be on watch to its future path.

Yuan

ECONOMY

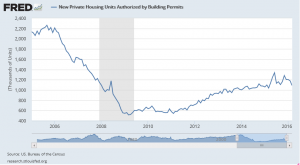
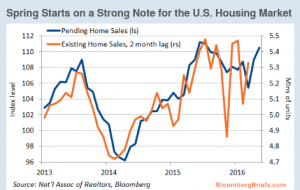
Industrial production increased by 0.7% in April. That was the biggest rise since November of 2014. Factory output improved by 0.3%. Housing started rose by 6.6% in April and building permits were up by 3.6%. Sales of homes are on the rise.

Housing Market BloombergBriefs

The Empire Manufacturing report which measures manufacturing activity in the New York region declined. The index has been up the two months prior. The Philadelphia region also reported lower readings.
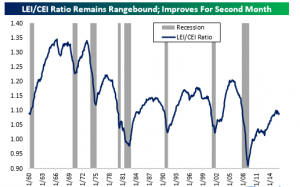
LEI/CEI

A good measure of an on-coming recession is the ratio of the Conference Board’s Leading Economic indicators to the Coincident Indicators. A series of new lows might indicate that a recession is on the way. But we have not seen that yet.

LEI to CEI ratioBespoke Invest

PAYROLL

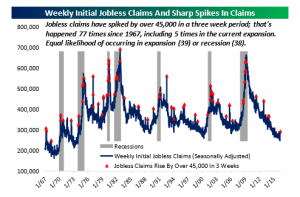
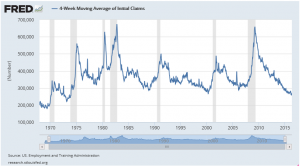
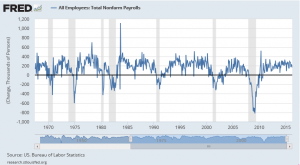
Initial unemployment claims came in at 278k. That is an improvement over last week’s 294k. The two prior payroll reports moved in the wrong direction so it was good that we got positive payroll numbers this week.

INFLATION

The consumer price index put in its biggest monthly increase since February of 2013, rising by a seasonally adjusted 0.4% in April. Gas prices contributed to the increase, up by 8.1%. The increase, excluding food and energy, was up by 0.2%. Core prices were up 2.1% year over year.

GDP ESTIMATES

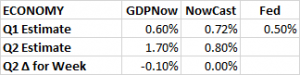
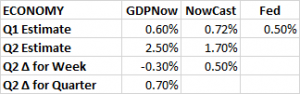
The Atlanta Fed’s GDPNow forecast for Q2 declined slightly from 2.8% to 2.5%. The drop was a result of (1) a lower forecast for real residential investment growth, (2) a drop in the forecast for real consumer spending growth and (2) a decline in inventory investment. However, the NY Fed number increase from 1.20% to 1.70%. If we split the difference we have a 2.1% estimate for Q2 growth.

GDP Estimates 5 20 2016

SUMMARY

The markets have begun pricing in the possibility of an interest rate increase in June or July. That, coupled with higher inflation data, has pushed up short-term interest rates while longer-term rates have been stable, resulting in a flatter yield-curve. The Chinese yuan is declining again. Economic numbers were mixed and payroll numbers improved but overall Q2 growth is on path to be higher than Q1.


Week Ending 5/13/2016

The market was down for the third week in a row. The US markets fell about 1/2% and the international markets were down almost 1%. The short-term momentum that has pushed the markets higher since February seems to be fading at this point. While the weekly trend has remained negative throughout this recent rally, the daily trend is now beginning to turn negative.

Spy 5 13 2016 Weekly Chart

The SPY closed at 204.76, it has bounced off resistance of about 203.90 a couple of times already, so that line is likely to be tested again soon.

SPY Daily Chart 5 13 2016

The US dollar increased for the second week in a row and that hurt the large caps. A higher US dollar makes our exports less competitive and hurts overseas earnings as they are translated back into dollars. Crude oil was up on the week 3.47%.

performance 5 13 2016

POLITICAL UNCERTAINTY

There has been a general consensus over the past week that the odds of a Trump Presidency have increased. Not to say that he is the odds on favorite, but sentiment has moved in his direction. Forgetting whether one believes that Trump will be great for the economy or terrible, there is no arguing that what policies he chooses to pursue and to what degree make his possible presidency much higher on the scale of uncertainty. And therein presents a problem for the markets and the economy. Uncertainty often means lower and/or volatile equity markets. Larry Summers went so far as to compare the US to an emerging market at the SALT Conference in Las Vegas, saying “political risk driving huge economic risk is something I always thought you talked about in connection with emerging markets. Now I think it is something you talk about in respect to the U.S.”

RETAIL

It was a tough week to be a retailer. Macy’s, JC Penny, Kohl’s and Nordstrom all had disappointing Q1 earnings and/or a disappointing outlook. Amazon is taking a bigger and bigger piece of the retail market and they seem to have really cut into the retailers over the past several months. According to the April retail sales report, online shopping was up 8.1% over the last four months.

In terms of the overall economy, the retail sales report did have good news, April retail sales were up 1.3% versus a 0.8% consensus. That was a big beat and was the main factor in pushing the GDPNow estimate for Q2 growth higher for the week.

GDP ESTIMATES

The retail sales report helped move the Atlanta Fed’s Q2 GDP estimate higher. GDPNow increased by 1.10% for the week to 2.80%. The NY Fed’s Nowcast also increased, but not by as much, to 1.20%. Both reports show improved growth over Q1.

Economy 5 13 2016

EMPLOYMENT

However, disappointing employment numbers would make one think that growth was declining, not increasing. Initial jobless claims came in much higher for the second week in a row. The number came in at 294k, up 20k from the prior week. It was the biggest gain in two years. We are closing in on the 300k level. The economy has held below that since March of 2015. Jobless claims are now up 46k since the low of 248k three weeks ago. Bespoke Investments ran an analysis showing that there have been 77 such spikes of 45k or more in initial jobless claims since 1967, including 5 in this current expansion. There is about a 50/50 split if an increase like this is indicative of a recession or continued expansion.

Initial Jobless Claims Spikes Greater than 45kbespokepremium.com

It might be that employment is going to start catching up with falling corporate profits. Profits have been down for more than a year now, but employment has held steady. At some point that divergence will most likely close. Either employment will fall or profits will improve.

Divergence between Jobs and Corporate Profits

On the other hand, the Job Openings and Labor Turnover Survey (JOLTS) report showed a 2.7% increase in the number of job openings in March to 5.757 million. Throughout this recovery, the job openings rate have been increasing faster than the hire rate, indicating mismatches between hiring needs and applicants able to fill those needs.

DIVIDEND CUTS

According to Standard and Poors, 213 companies have cut their dividends during the first four months of the year. That is the highest number since 2009 when 298 companies made cuts during the same time period. The energy sector was the main culprit.

SENTIMENT

The American Association of Individual Investors conducts a weekly survey of market sentiment. 20.4% of investors are bullish, that is the lowest reading since the week of February 11th when the market hit its low for the year. However, bearish sentiment is only 1% above the norm at 31%. In late January that number was above 40%. Most investors have now moved into the neutral camp.

EARNINGS

91% of SP500 companies have now reported. The blended earnings decline is 7.1% versus an expected decline of 8.8% on March 31 (per FactSet). The forward p/e is 16.60. The energy sector has reported a year-over-year earnings decline of 107.20%.  Excluding the energy sectors, earnings would be down 1.80% for the SP500. Companies are still reporting that the high US dollar has negatively impacted earnings.

There is a belief out there among some that we have hit a trough in earnings and that they should begin to stabilize for a quarter or two and then begin to increase. Improved earnings would give the market reason to move higher.

RISK IN BONDS

At some point interest rates will go up, and bonds will go down. Investor are clamoring for safety and whatever drop of yield they can find. That has pushed 30-year municipals down to an all-time low.

Municipal Bond Yields Hit 30-Year Low

Along those same lines, governments, especially in Europe, have been borrowing long-term at ultra low interest rates. When interest rates begin to rise, even a little, holders of those bonds will face losses. Finance ministers may not view that as a problem, after all, it is the investors that will take the hit. But one of the problems is that the main investor in much of this debt are the same banks that these same governments have helped bail out. Higher interest rates in the future will hurt these same banks.

Eurozone Sovereign Overload

SUMMARY

Short-term market momentum and positive employment reports have been helping the equity markets and the economy since February, but both of those factors appear to be fading. It seems like the market is running out of fuel, turning down towards the end of the week after a promising start on Monday and Tuesday. The market is now down about 2.5% from its recent peak. Overall retail sales were a positive surprise, and that actually pushed GDP estimates for Q2 higher. Disappointing employment numbers are something to watch and are of concern. The economy cannot seem to get any serious positive traction. That coupled with the uninspiring choices for President have not helped.

Week Ending 5/6/2016

Week Ending 5/6/2016

The market was down slightly for the week, the overall US market as measured by the VTI fell 0.50%, international markets as measured by the VXUS were down 2.38% and the aggregate bond index as measured by the AGG rose 0.26%. The US dollar also rallied by 1.29% and crude oil fell by 2.74%.

performance 5 6 2016

The market has now fallen two weeks in a row but the move has been small. The SP500 (SPY) is only off 2.1% from its recent high of 210.10 on April 20th. On Friday, the market opened almost at the low of the day, pushed against a resistance line (see the yellow line below) and bounced right off it and finished pennies off its high from the day. So even in the face of falling prices over the last couple of week, the equity market has shown pretty good strength.

SPY Daily Chart 5 6 2016

REITs had a big week. The VNQ rallied 4.6% and broke out to a new high. In the face of a slow growth economy, low interest rates, and stable to increase real estate values, higher yielding REITs have become more attractive.

VNQ 5 6 2016

GDP Q2

Q2 GDP estimates remain in line with last week, GDPNow (Atlanta Fed) drop by 10 basis points. to 1.70%. The NowCast (NYFed) remained at 0.80%.

GDP Estimates 5 6 2016

MANUFACTURING

The Institute for Supply Management’s (ISM) Index for manufacturing fell to 50.8 from 51.5 in April, but remained about the breakeven level of 50 indicating expansion for the second straight month. It was a disappointing number but at least it was still positive. The export index, helped by a lower dollar, rose to its highest level since November of 2014.

Global PMI fell to 50.1 from 50.5. This is just 0.1 point above the 39-month low from February of this year. Employment fell for the third month in a row. Inventories did decline at the fast pace since July of 2013. That means if sales picks up, it would translate into new manufacturing, as opposed to working down existing inventory.

Japan fell to 48.2, probably impacted by the higher yen. The UK PMI dropped to 49.2, dropping into contraction territory for the first time in three years. Uncertainty from the Brexit vote gets the blame there.  China fell to 49.4, but that is still up from the September low. Brazil was a disaster, coming in at 42.6. The Eurozone did increase by 0.1 to 51.7. Other positive countries were Australia, Mexico, Vietnam and emerging Europe.

Overall, 60% of individual countries are still in expansion territory, that is down from 69% last month. The global economy appears to be just keeping its head barely above water and we are still on a global recession watch.

PMI for April 2016

SERVICES / COMPOSITE

The numbers were better on the services side. The ISM Non-Manufacturing Index rose to 55.7, up from 54.5. That is the highest level this year. So while manufacturing was a disappointment, the service number was better than expected.

Combined, the ISM Composite Index rose to 55.1. That also is the highest reading of the year.

EMPLOYMENT NUMBERS

Employment statistics have been the linchpin of the US economy in recent months. But this week the numbers were not as strong as we have become accustomed to. Jobless claims came in at 274k, which was the highest reading in five weeks. Relatively speaking 274k is a very good number, just not as good as the very low numbers we have been seeing. The unemployment rate remains at 5%. Only 160k new jobs were created. That number was a disappointment and lower than the 200k consensus. It is going to be hard for the economy to keep creating 200k+ jobs per month in a slow growth economy.

In our quarterly webinar we cited 5 factors that often are leading indicators for a recession, two of them are rising jobless claims and declining employment. While rising claims were up and the change in newly created jobs was down, these two numbers are are not yet indicative of a trend.

Initial Claims 4-Week Moving Average 5 8 2016 Total Nonfarm Payrolls April 2016

The weaker than expected employment numbers likely diminished the chances of a June rate increase by the Fed.


Week Ending 4/29/2016

The market finally retreated. Although it was slight. The overall US market as measured by the VTI dropped 1.21%, the SP500 as measured by the SPY was down 1.26% and international x-us was down 1.27%. Bonds advanced 0.33% and the US dollar fell 2.04%.

For the month, the US market was up 0.66%, the SPY was up 0.39% and international x-US was up 2.16%. Some of the tech stocks really got hurt in April, AAPL -14.0%, GOOGL -7.2% and MSFT -9.7%. AAPL now sells at less than 12x 2016 earnings, yields 2.43% and has a free cash flow yield of about 10%. Compare that to a 20-year treasury which yields 2.26%! But nobody wants AAPL right now and the stock has fallen hard.

Value, small caps and resource stocks outperformed in April. Treasuries were mostly down but the corporate investment grade and high yield markets had nice rallies. The aggregate bond index was up 0.25%. Treasury rates were up about 5 basis points across the curve. The dollar was down and oil had a major rally, up 19.77%.

The correlation between oil and stocks did not hold this week. While stocks fell oil moved ahead by 5.15%. As we move away from $40 per barrel oil and get closer to $50 that correlation will likely begin to decline.
Year to date the US markets are up 1.64%. Bonds have been the bigger winner, up 3.30%.

performance 4 29 2016

EARNINGS

While earnings overall are down year over year, the reported numbers versus expectations have been better than expected. 62% of SP500 companies have reported earnings per FactSet. 74% have beaten their mean earnings estimate and 55% have beaten their sales estimate. So far, earnings are down 7.6%. The estimated earnings decline was about 9% when Q1 ended.

Normally, earnings estimates for a quarter decline during the first few weeks as analysts are often a little too optimistic going in, and need to readjust as the quarter begins. For this quarter (Q2), analysts have lowered earnings estimates for the SP500 companies by 1.8%. Over the last year, earnings estimates were dropped by an average of 2.8% during the first month of the quarter. Looking back over the last five years, analysts have dropped earnings estimates by 2.2% during the first month and over the last 10 years the average was a 2.3% drop. So the current estimated decline of 1.8% for Q2 is better than the recent averages.

Likewise, the spread between companies raising guidance versus lowering guidance has been almost flat.  So while we would not say that earnings are going to be really good going forward, they may be better than what analysts estimate.

Spread on Forward Guidance - Bespokepremium 4 29 2016

ECONOMY

The Bureau of Economic Analysis released their advance estimate of Q1 GDP showing slow growth of 0.50%. It was the lowest number since Q1 of 2014, when the number was negative. In past years, Q1 has been the slowest quarter of the year, if the pattern holds, growth will accelerate from here.
Private nonresidential fixed investment, or capex, fell at a 5.9% annual rate. As would be expected, investment in energy exploration was the main culprit, plunging by 86%. With oil prices on the rebound, investment in the energy sector should begin to stabilize.

Inventory to sales continues to rise. That would be a negative sign for the economy. At some point inventory levels will revert to the mean and to do so, there would likely be a drop in purchasing for a while, slowing the economy.

Autos and housing are not contributing to the economy at their historical levels. The strong job market has helped employees. Their compensation as a percentage of nominal GDP has been rising.

Transfer payments from the government to households continues to rise. Healthcare costs (Medicare and Medicaid, marked in light and dark blue below) are driving most of the increase. Transfer payments are now around 15% of GDP compared to about 4% in 1947.

Transfer Payments Bespoke Premium 4 29 2016

All of this adds up to not much, in terms of growth, which is why GDP is estimated to have grown at only 0.5%.

For Q2, current estimates show a small improvement over Q1. The Atlanta Fed’s GDPNow currently shows growth of 1.80% and the NY Fed Nowcast currently forecasts growth 0.80% for the second quarter.

JOBS

The initial jobless claims number came in a 257k. Up by 9k from last week but still very low. The job market has been the one very big bright spot in the economy. The four-week moving average is at its lowest level since 1973.

HOME SALES

Pending home sales were up by 1.4% in March, higher than the consensus estimate of 0.5%. It would be a big positive if housing can begin approaching historical norms.

FED

The Fed released a statement on Wednesday. They gave no indication of when they will raise rates again and the statement was noticeable in that it did not emphasize international risks as much as previous statements. The Fed is probably looking at 1 to 2 hikes this year, with a slight chance for a June increase, although we would need some firming economic numbers and stable financial markets. The Brexit vote is just after the June Fed meeting so the Fed would also have to be confident that the “no exit” choice would win to raise rates in June.

One reason why growth might be slowing is that the Fed’s balance sheet, as a percent of GDP has been declining since the end of 2014. The Fed has maintained its assets at about $4.5 trillion during that time, but as GDP has grown, the percentage to GDP has declined. The net effect is the Fed’s balance sheet has less of a stimulating effect on the economy than a couple of years back.

Feds Balance Sheet as Percentage of GDP - Bloomberg

EUROZONE

While the US is dragging along almost at stall speed, growth in Europe is beginning to accelerate. GDP in the Eurozone grew at an annualized pace of 2.2% in the first quarter, increasing at a rate of 2x the previous quarter. Inflation adjusted GDP has finally surpassed the 2008 level. However, economists are only expecting growth of 1.6% for the entire year.

Europe Comes Back Like It's 2008


SUMMARY

We did get a small pullback in the market last week. After the big run up we had expected such and there might more on the way. The market needs to put in a higher low and then resume its run and set new highs to turn the weekly trend positive. Earnings are bad but not as bad as analysts thought they would be. Estimates for Q2 are not falling as much as they normally do at this time of year, hopefully a positive sign. The economy really dragged in the first quarter but has avoided recession and economic growth around the world is slowly improving.
Watch our Market Outlook: https://www.youtube.com/watch?v=ORQGdDtTpTQ

Week Ending 4/22/2016

The market was up again as all of the equity indexes moved higher. The US total market ETF (VTI) advanced 0.70%, the SP500 ETF (SPY) was up 0.57% and international x-US ETF (VXUS) was up 1.66%. The bonds (AGG) were down 0.39%, the US dollar (BUXX) increased by 0.58%.

Performance 4 22 2016

At some point there will have to be some kind of pullback in the market. As we have written about for weeks now, the market has not taken the opportunity to head lower on the many instances it had the chance. Thursday looked like one of those days. The market dropped by about 1/2% and closed near its low. On Friday, the market headed lower out of the gate but managed to rally to close at about break even. There was no follow through and that has been the case since February 11.

The volatility index (VIX) is down to levels we haven’t seen since August of 2015. The VIX will usually move opposite the direction of equity markets. So if the stock market is going down, the VIX will be going up. We wrote a few weeks ago that with so many traders betting on spike in volatility, they might end up on the wrong side of the trade, and that is what happened. But as the VIX pushes lower and lower it is indicating that the traders are just too comfortable and they are ignoring short term risk. The equity market will respond and go lower and the VIX will go higher. It does not have to be a dramatic move lower, but some kind of market pullback would make sense. On the other hand, you can make the argument that I am not the only person thinking that so maybe the market will continue to move higher uninterrupted.

Earnings were disappointing for the big tech companies. Weaker than expected earnings from GOOG, MSFT, AAPL, NFLX and INTC pushed those companies lower. Also, high quality, low volatility type companies (like KO, VZ and utilities) under performed.

On the plus side, market breadth, which is a measure of advancing and declining stocks, has been moving higher. Often a divergence between market prices and market breadth will foretell a change in market direction, but the fact that they are both moving up together is a positive sign.

Breadth(bespokeinvest.com)

Long dated bonds in the US fell and that led to losses for the aggregate bond index. As interest rates go up, bond prices go down. The move higher in rates might be a result of investors anticipating higher growth and/or inflation.

MARKET REVIEW/OUTLOOK

We did our quarterly Market Review/Outlook for BlueKey last week. It is about a 30-minute presentation. Please check it out and contact us with any questions.

ECONOMY

Housing reports were weak. Housing starts declined by 8.8% and building permits were down 7.7% compared to the previous month. The building permit number is now less than the previous low set in September. Part of the problem is that builders are focused only on high end homes whereas the demand appears to be at the lower price points.

Building permits

The Conference Board’s Leading Economic Index increased by 0.2%. This was the first increase in four months. Year over year it was up 2.2%, suggesting slow but steady growth.

The Philly Fed General Business Activity Index fell 14 points to -1.6. This reversed the gain from last month and put the index back in contraction territory.

It was another banner week for initial jobless claims. The number fell to 247k. This is the lowest level since November of 1973.  The job market continues to be strong and is near full employment levels.

OIL

When the price of oil has been less than $50 per barrel, there has been a high correlation between its price and the stock market. This becomes even stronger between $25 and $40. When oil started to fall south of $50 it really began to threaten debt markets, led to big pullbacks in capital spending and job cuts, which led to the equity markets falling with the price of oil. The markets worried about spillover effects. As the price approaches $50 the correlation should begin to go back to normal.

Crude Analysis- Whats the Magic Number for the Oil Price WSJ April 20 2016

EARNINGS

Earnings have not been that bad. To date, 26% of SP500 companies have reported. 76% have beaten earnings estimates and 55% have beaten sales estimates.

SUMMARY

Short-term momentum continues to be a powerful force moving the market higher. Interest rates turned higher and that will have to be watched. Economic statistics continue to be mixed, but that has been the case for a long time now, we are in a flat to very slow growth economy, but the job market is strong.

Week Ending 4/15/2016

The market bounced off its lows from last week and the overall US market (VTI) moved ahead by 1.79%, the SP500 (SPY) +1.60% and overseas x-US (VXUS) +3.00%. The bond index and was roughly flat at +0.06%.

performance 4 15 2016

The equity markets continue showing strong resilience. The market has closed at or near the low at least 8 times since February 11th but there has not been any follow through. The SPY is now close to testing and possibly breaking through the downtrend line set from the highs last May.

SPY WEEKLY CHART 4 13 2016

A good internal signal is that the cumulative advance/decline line is showing even more strength than the market.

Cumulative AD Liine 4 17 2016 Bespoke Report

OIL

The market might be tested on Monday. Over the weekend OPEC held a meeting to decide on a production freeze but they could not reach an agreement. Remember on February 11 it was talk of a possible production freeze that set the low for oil which helped sparked the market rally.

CHINA

The market was helped by news from China. Q1 GDP came in at +6.7%. Recent PMI numbers have also shown a positive pattern. The general feeling is that the economic storm in China has settled down at least for now.

US ECONOMY

It was a mixed week for US economic data. Retail sales fell 0.3%, industrial production fell 0.6% and the NFIP small business optimism report declined. Most of the retail sales weakness was due to autos. X-autos retail sales were up 0.2%. On the plus side, we got another very strong initial unemployment claims report, new claims totaled 253,000. This is the lowest level since 1973. Another positive was the Philly Fed report which increased for the third straight month. This has been the largest three month increase since October of 2009.

SUMMARY

The market continues to show strength, but has risen almost 14% since February 11, it is overdue for a pullback. Economic reports continue mixed, growth remains slow to flat.


Week Ending 4/8/2016

The market showed some possible signs of cracking this week. The US averages were down a little more than 1%, international markets were down only 0.18% and the bond index managed a 0.33% gain. What was most disconcerting was the performance on Friday, the market was up almost 1% but gave most of it back and ended up only 0.27%. That came after a brutal Thursday when the market fell 1.2%. Nevertheless, the market still has held support at $203.90 on the SPY.

While the market is up on a daily basis, the trend is still down on a weekly and monthly basis. Oil rose 8% to $39.72 per barrel. Analysts are starting to suggest that we have seen the low in oil.

performance 4 8 2016

FED

The Fed released the minutes from their meeting on March 16th. The minutes highlighted weakness in the global economy. The Fed will be taking a more passive approach towards raising interest rates. We are probably looking at one, maybe two increases for the year. It is possible that we don’t even see a single increase if the global economy remains shaky and overseas rates hover around the zero area.

EARNINGS

Earnings season starts Monday. Earnings are expected to decline for the fourth straight quarter. Energy earnings are expected to be negative. However, the earnings problem is bigger than just energy, take energy out and analysts still expect a drop of 4.2%. AAPL earnings should be down 19% year over year. 94 SP500 have issued negative guidance. For all of 2016, analysts are looking for an increase of 2.1% as the negative impact of falling oil prices and the rising US dollar begin to fade away. While analysts have been clearly negative on this past quarter, over the last four weeks they have actually raised earnings estimates for 443 companies in the SP1500 and lowered the forecast for 495.  That is a much more balanced tradeoff between plus and minus revisions than we saw earlier in the year.

ECONOMIC REPORTS

Initial claims for unemployment insurance fell to 267,000 last week, down 9,000. The new global PMI reports came out and the number increased to 50.5 in March. The previous report in February was more negative and suggested a higher probability of a global (not US) recession. This report shows that the new orders component of the report rose to 51.2, a positive number that might indicate the global economy is on a slow mend. On the negative side, employment and exports were down. 70% of the countries reporting are in expansion territory, the highest number so far this year. There will need to be more follow through in future months to see if the recovery can sustain itself.

VENEZUELA / ARGENTINA

Problems continue in Venezuela. Fridays are now a holiday in Venezuela through May in an effort to cut energy production. Credit default swaps indicate a 72% chance of default in the next year and almost 100% over the next five years. On the other hand, Argentina which has started to implement a more free market economy is going to the market with $12b in sovereign debt in the near term.

SUMMARY

The market has been overdue for a pullback. It looks like we are getting close. If the SPY cannot hold support at $203.90 we will probably get the pullback. A small pullback at this time would be natural and would set the stage for the next leg up. A bigger pullback combined with weakening economic data could reignite recession fears.

Weekly/Monthly/Quarterly Recap

Weekly/Monthly/Quarterly Recap

The week ended on a high note as the market continued to resist the chance to turn negative. The SP500 (SPY) opened down on Friday 0.57% but then went straight up for the rest of the day closing up 0.69% on the day and at the high for the year at 206.92. For the week, all the broad ETFs were up, the overall US market (VTI), +2.09%, the SP500 (SPY), +1.87%, international x-US (VXUS), +0.91% and the aggregate bond index (AGG), +0.57% (all of our calculations include dividends).

March ended on Thursday and what a month it was. The market put the finishing touches on a monumental comeback as the US market climbed 7.11%, the SP500 was up 6.72%, international x-US +8.32% and the bonds were up 0.88%.

If you were an investor that only looked at your quarterly statement, you would find that the US markets had a moderate increase as the overall US market was up 0.97% and the SP500 was up 1.33% for the three-month period. International markets (x-US) dropped 0.42%. You probably would assume it was a calm, steady, increase. You would be wrong! The market took investors on a wild ride but ended up in about the same place as where it started. It was almost straight down and then straight up. The market got off to its worst start ever for the first two weeks of the year. From December 31 through the closing low on February 11, the SPY was down 10.31% and had hit a 22-month low. From that point it rallied 12.97% through the quarter ending close on Thursday, overall up 1.33% for the quarter.

The quick summary for the quarter was that the market fell on fears of a possible US recession but then as economic reports began to make clear that the threat of a near-term recession was minimal the stage was set for the recovery rally.

Fixed income outpaced equities. The AGG advanced each month and combined for a 3.03% gain for the quarter. Treasury bonds were up 8.15%. US fixed income is being helped by more quantitative easing in Europe and by negative interest rates in Japan which have pushed overseas rates lower increasing demand for US treasuries.

Gold was the top performing asset class, up 16.5% for the quarter. Commodities turned positive this quarter, up 3.78%. Emerging markets were up 2.73%. The dollar was down by 4.15%.

PERFORMANCE CHART 4 1 2016

MANUFACTURING

The Institute of Supply Management (ISM) showed an increase in manufacturing activity for March. This was the first increase in six months. The index came in a 51.8, up from 49.5 in February. A number above 50 indicates growth. Since declining to slow manufacturing activity earlier in the year led to the fears of a recession, a higher number is a big positive.

PAYROLL

Nonfarm payroll in March increased by 215,000 jobs. For the quarter, the average gain was 209,000. That was up by 19,000 jobs compared to the average during the first three months of 2015. Year over year average hourly earnings were up 2.3%. The unemployment rate ticked up to 5.0% from 4.9%, as more people entered the labor force. Initial claims for unemployment rose to 276,000, the highest number in eight weeks but still a relatively low number.

VOLATILITY

As a follow up to our note last week on the volatility ETFs, we wrote that the huge increase in bets on funds like UVXY and TVIX might signal that the market might not act in a way these traders want. That turned out to be correct as the UVXY fell 22% and TVIX fell 19.6% on the week.


Week Ending 3/25/2016

The equity market’s winning streak ended this week as the major indexes fell slightly. The overall US market (VTI) dropped 0.78%, the SP500 as measured by the SPY was down 0.62% and international markets (x-USA) were down 1.91%. The aggregate bond index was about even, falling 0.05%.

performance 3 24 2016

BETTING ON VOLATILITY

As the market has moved higher traders have been increasing their bets on volatility ETFs like TVIX or UVXY. These ETFs move counter to the market. So if the market is going down, these ETFs usually go up. With volatility priced low, and with the recent rally in the markets, traders have been anticipating a pullback, hence, the increased demand for these ETFs. TVIX brought in $160m on Monday and UVIX has added $723m over the last several weeks. But the market has a funny way of doing what everyone doesn’t expect. The big run-up off the February lows has had these traders and investors, including ourselves, thinking some kind of pullback might be in order, but the market simply has refused to cooperate, at least so far. Despite multiple chances to decline, including on Thursday when the Dow was down over 100 points in the morning, the market has not followed through on the downside. The market closed at its high on Thursday and pretty much at break even for the day. Similar to past rallies over the last few years, the market might be setting itself to do the unexpected and continue even higher with little pause.

But traders/investors looking for a hedge by going long the volatility ETFs need to be aware of their idiosyncrasies. These ETFs are betting on the VIX index. The VIX is not a stock or a fund or anything like that, the VIX is a complex mathematical formula to calculate the expected volatility of the SP500 based on the weighted average of out of the money puts and calls due to expire in about 30-days. Since the VIX is not anything tangible, no one can actually purchase the VIX. But there are future contracts available on the VIX and that is how these funds get exposure to the mathematical VIX calculation. These futures contracts are settled in cash at expiration. The volatility ETFs are based on buying and selling these futures contracts. The futures contracts do not track the actual VIX dollar for dollar. They go up and down based on many factors including the time left until the contract expires.

And that is why going long a volatility ETF is such a dangerous game. While a trader could hit a big payday if the market falls, especially if it happens quickly and unexpectedly, there is usually a huge wind pushing against the long trader every single day. This is called the “roll yield.”

Normally the near-term futures contract is priced lower than a longer dated contract with an expiration date further out. The futures market is said to be in “contango” when it is in this state. The ETFs will own the near-term (and cheaper) contract, but have to “roll” into the longer-dated (and more expensive) contract over time. So the funds are essentially selling low and then buying high, this eats away at the value of the future contract with each transaction. This differential is the “roll yield” and that is why buying a volatility ETF is a loser’s game over time. The trader is betting that he can overcome the roll yield by a sharp decline in the market and that he can get in and out of the fund before the roll yield eats away at this return.

The VXX is a volatility ETF started in 2009, it is down 99% since its founding. But the fund rallied 42% from December 31, 2015 to the market low on February 12. That is the appeal of these funds. The timing has to be just right for the big payoff.

There are rare times when the volatility markets are not in “contango” but in a state called “backwardation.” This is the opposite of contango. When a market is in backwardation, the near-term contract will be more expensive than the longer dated contract. When this happens, and it is rare, the volatility fund will have a tail wind at its back. The fund would then be selling high and buying low.

Needless to say, volatility ETFs are a high stakes game and not for the faint of heart.

HERE COMES THE WAVE

We have been waiting and it is starting to arrive. The percent of energy loans classified as in danger of default will be greater than 50% at some point this year at several of the major US banks. Banks are trying to limit their exposure be selling off the loans at a discount, not renewing the loans and cutting back on credit lines. According to the law firm of Haynes and Boone, LLP, 51 producers with $17.4b in debt have already filed for bankruptcy. The most exposure might be to the regional banks like Comerica and BOK Financial, not the majors, as the majors have already begun the process of writing off the loans and have smaller overall exposure.

Bad Loans Hit the Oil Patch WSJ Mar 25 2016

ECONOMIC NEWS

Over the last couple of months, we saw some signs that the manufacturing sector, while still not in growth mode, was at least beginning to stabilize. That thesis took a hit backwards when the new durable goods report came out. New orders for products designed to last three years or more fell by a seasonally adjusted 2.8% in February. That report moved the Atlanta Fed’s GDPNow forecast of 1st quarter growth down to 1.4% from 1.9% the previous week. The GDPNow number was north of 2% a few weeks back, but has fallen over the last few weeks, but it is still positive indicating slow growth.

The Chicago Fed National Activity Index (CFNAI) report for February was mainly negative after a strong January report. All of the major categories were lower. The Employment contribution fell to its lowest reading since September. On a positive note, January was revised higher. The three month moving average is showing growth of about 2.6%.

Existing home sales came in at a seasonally adjusted rate of 5.08m versus 5.47m in January. But new home sales increased by 2% in February to 512k annual rate. There appears to be a big mismatch between where the demand is and what the supply is. In other words, there is demand for lower priced starter homes but there is not supply in that price category. According to Trulia, there were only 238k starter homes on the market versus 423,000 in 2012.

The Richmond Fed Manufacturing Index came in very strong, up 26 points to +22, that is the highest level since April 2010. The Composite and Shipments month over month jump was the largest ever, and the New Orders increase was the second highest ever. These increases, together with the increases last week in the Empire Manufacturing report and the Philly Fed report show some strong regional strength around the country.

However, that strength did not carry over to the Kansas City region. The Kansas City Fed Composite Index moved in the right direction, rising six points, but was negative overall, scoring a -6 for March. This was the 13th straight month of a contracting manufacturing activity in that region.

The ATA For-Hire Truck Tonnage Index was up 7.2% for February and was up 8.6% year over year, indicating faster economic growth in Q1.

UNEMPLOYMENT

Initial claims for unemployment remains low, coming in at 265,000 for the most recent reading. The four-week average is 259,750, which is close to the lowest level since 1973. The labor market remains tight.

SUMMARY

Overall, the economic reports had a negative tilt this week, however, we still do not see a recession in the near-term. The market declined just slightly. The market has shown a lot of resilience of late and that might be a “tell” for a stronger market down the line.


Week Ending 3/18/2016

BACK IN THE BLACK

The market continued its remarkable comeback and put in gains for the 5th week in a row, and is now up for the year. The overall US stock market as measured by the VTI was up 1.38% (dividend adjusted), the SP500 as measured by the SPY was up 1.32% (dividend adjusted), international markets (x-US) as measured by the VXUS was up by 0.63% and the aggregate bond index as measured by the AGG was up by 0.69%.

DJI Chart 3 18 2016

The SPY is just under 2 standard deviations above its 50-day moving average, normally indicating an overbought condition. But this market has continued to rise over the last few weeks despite opportunities to turn south.

The market was helped by the Federal Reserve, which prior to Wednesday was still holding the line on four interest rate increases this year. But the Fed got in tune with the market projections, and said rates would rise at a more measured pace, probably two more times this year.

ECONOMIC REPORTS

Economic reports were for the most part positive this week. The New York Empire Manufacturing Report went into positive territory for the first time since July. The Philadelphia Fed Manufacturing Survey also showed positive numbers, the first time since August. Both imports and exports at the west coast ports of Los Angeles, Long Beach and Oakland showed increases. There was some negative data on a report measuring jobs openings. Numbers were revised down for December to 5,281,000 from 5,607,000. But the unemployment report continued to be low, coming in at 268,000 in initial claims. That is up slightly from last week but still a very good number. We have now been at less than 300k on the unemployment claims report for 54 weeks and that is the longest streak since 1973.

SUBPRIME AUTO LOANS

Problems are emerging with subprime auto loans. Delinquencies greater than 60-days on loans packaged into bonds over the last five years are now at the highest level in two decades, 5.16%. Moreover, the rate is of delinquency is higher on the new loans than the older loans, indicating that standards for loans have recently been made easier. Subprime auto loans have helped power the auto industry’s recent record sales, and any pullback in the availability of these loans would impact the auto manufacturers.

US DOLLAR

The Chinese currency, the yuan, had its biggest one-day advance against the dollar, rising 0.52%. Although analysts do not seem to believe the currency’s strength is a sustainable trend. As a side note, Trump and other candidates have been arguing that China is manipulating their currency lower, the exact opposite of what is really happening.

Other currencies have also been gaining against the dollar, the WSJ Dollar Index, which tracks the dollar against 16 currencies, hit its lowest level since June on Thursday (see the chart above). A lower or stable dollar should be a positive for earnings for the SP500, as it makes their products more competitive overseas. A rising dollar was one of the obstacles to rising earnings last year.

COMMODITIES

The 3.5 year decline in commodities might be coming to an end. The CRB Commodity Index is up 13% over the last 35 days. Commodities tend to run in trends that last a good length of time so if this is not a head fake we might be at the start of a bull run.

UNINTENDED CONSEQUENCES

Duke University’s Fuqua School of Business did a survey of CFOs to determine the impact of a rise in the minimum wage to $15. Such a dramatic rise would be negative on employment. 41% said they would lay off current workers and 66% said it would slow the pace of future hiring. 66% also said benefits would be cut and 49% said prices would have to be raised. The point is that such a huge increase over a short time period will impact the way business is done, probably speeding up the pace of automation and lowering employment.

THE RISE OF TRUMP

Speaking of unintended consequences, the rise of Trump and his style closely matches recent Latin American authoritarian figures like Hugo Chavez and Rafael Correa. In the leading Venezuelan daily, the “El Universal”, Roberto Giusti compared Chavez and Trump, “consummate showmen with a shrewd ability to manage emotions of a large audience and, using a mixture of half-truths, pin the blame for people’s ills on enemies, real or imagined.”

In Latin America, the populists blame big business and corrupt politicians for working with the United States. Trump has spun that strategy around and blames our problems on immigrants and the “very smart” Chinese and Mexicans that have outfoxed our “stupid” leaders. Bernie Sanders strategy is a softer version of Trump but puts the blame on big business and the rich. Neither candidate has realistic solutions.

Incredibly, in 1998, Chavez actually got the majority of the middle class vote. Look at Venezuela now. There barely is a middle class left and the country’s economic system has been destroyed.

SUMMARY

The market has come a long way in a short time. Economic news in the US continues to be on the favorable side, and the fear of a recession which really hammered the market earlier in the year has somewhat faded. The rising price of oil as helped that. At this point, the market is probably somewhat overbought. So some kind of pullback would not be unexpected.